"Eliminating water shortages depends on a global attempt to raise water productivity similar to the effort launched a half-century ago to raise land productivity, an initiative that has nearly tripled the world grain yield per hectare." –Lester R. Brown, World Facing Huge New Challenge on Food Front in Plan B 3.0: Mobilizing to Save Civilization
Chapter 7. Feeding Everyone Well: Restructuring the Protein Economy
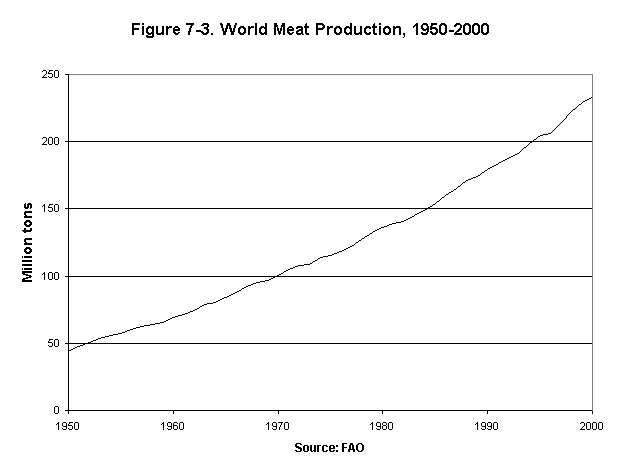
The demand for meat—beef, pork, poultry, and mutton—typically rises with income, perhaps driven by the taste for meat acquired during our 4 million years as hunter-gatherers. This innate hunger for animal protein, which manifests itself in every society, has lifted the world demand for meat each year for 40 consecutive years. One of the most predictable trends in the global economy, world meat production climbed from 44 million tons in 1950 to 233 million tons in 2000, more than a fivefold increase. (See Figure 7-3.) This growth, roughly double that of population, raised meat intake per person worldwide from 17 kilograms to 38 kilograms.39
Once the limits of rangelands and fisheries are reached, then the growing demand for animal protein can be satisfied by feeding cattle in feedlots or fish in ponds; by expanding the production of pork, poultry, and eggs, all largely dependent on feed concentrates; or by producing more milk.
In this new situation, the varying efficiency with which grain is converted into protein—beef, pork, poultry, and fish—is shaping production trends. Cattle in feedlots require roughly 7 kilograms of feed concentrate per additional kilogram of live weight. For pigs, the ratio is nearly 4 to 1. Chickens are much more efficient, with a 2-to-1 ratio. Fish, including both herbivorous and omnivorous species, require less than 2 kilograms of grain concentrate per kilogram of gain.40
There are three ways to increase animal protein supply without consuming more grain: improve the efficiency of grain conversion into animal protein; shift from the less efficient forms of conversion, such as beef or pork, to the more efficient ones, such as poultry or farmed fish; and rely on ruminants to convert more roughage into either meat or milk.
Not surprisingly, the economics of the varying conversion rates is accelerating growth in output among the more efficient converters. The world's existing feedlots are being maintained, but there is little new investment in feedlots simply because of the higher cost of fed beef. From 1990 to 2000, world beef production increased only 0.5 percent a year compared with 2.5 percent for pork. The most rapidly growing source of meat during this period was poultry, expanding at 4.9 percent annually. (See Table 7-3.)41
The oceanic fish catch has not increased appreciably since 1990, thus falling far behind the soaring growth in demand for seafood. In response, aquacultural output expanded from 13 million tons of fish in 1990 to 31 million tons in 1998, growing by more than 11 percent a year. Even if aquacultural growth slows somewhat during the current decade, world aquacultural output is still on track to overtake the production of beef by 2010.42
China is the leading aquacultural producer, accounting for 21 million tons of the global output in 1998. Its output is rather evenly divided between coastal and inland areas. Coastal output is dominated by shellfish—mostly oysters, clams, and mussels. It also includes small amounts of shrimp or prawns and some finfish. Coastal aquaculture is often environmentally damaging because it depends on converting wetlands into fish farms or because it concentrates waste, leading to damaging algal blooms.43
Except for shellfish, most of China's aquacultural output is produced inland in ponds, lakes, reservoirs, and rice paddies. Some 5 million hectares of land are devoted exclusively to fish farming, much of it to carp polyculture. In addition, 1.7 million hectares of riceland produce rice and fish together.44
Over time, China has evolved a fish polyculture using four types of carp that feed at different levels of the food chain, in effect emulating natural aquatic ecosystems. Silver carp and bighead carp are filter feeders, eating phytoplankton and zooplankton respectively. The grass carp, as its name implies, feeds largely on vegetation, while the common carp is a bottom feeder, living on detritus that settles to the bottom. Most of China's aquaculture is integrated with agriculture, enabling farmers to use agricultural wastes, such as pig manure, to fertilize ponds, thus stimulating the growth of plankton. Fish polyculture, which typically boosts pond productivity over that of monocultures by at least half, also dominates fish farming in India.45
As land and water become ever more scarce, China's fish farmers are feeding more grain concentrates in order to raise pond productivity. Between 1990 and 1996, China's farmers raised the annual pond yield per hectare from 2.4 tons of fish to 4.1 tons.46
In the United States, catfish, which require less than 2 kilograms of feed per kilogram of live weight, are the leading aquacultural product. U.S. catfish production of 270,000 tons (600 million pounds) is concentrated in four states: Mississippi, Louisiana, Alabama, and Arkansas. Mississippi, with some 45,000 hectares (174 square miles) of catfish ponds and easily 60 percent of U.S. output, is the catfish capital of the world.47
Public attention has focused on aquacultural operations that are environmentally disruptive, such as the farming of salmon, a carnivorous species, and shrimp. Yet these operations account for only 1.5 million tons of output. World aquaculture is dominated by herbivorous species, importantly carp in China and India, but also catfish in the United States and tilapia in several countries.48
Just as aquaculture is supplementing the fish catch, new practices are evolving to efficiently expand livestock output. Although rangelands are being grazed to capacity and beyond, there is a large unrealized potential for feeding agricultural residues—rice straw, wheat straw, and corn stalks—to ruminants, such as cattle, sheep, and goats. This can mean that a given grain crop yields a second harvest—the meat or the milk that is produced with the straw and corn stalks. Ruminants have a highly sophisticated digestive system, one that can convert straw and corn stalks into meat and milk without using the grain that can be consumed by humans. At present, most human food comes from the photosynthate going into the seed of cereals, but by feeding animals straw and corn stalks, the photosynthate that goes into stems and leaves also can be converted into food.49
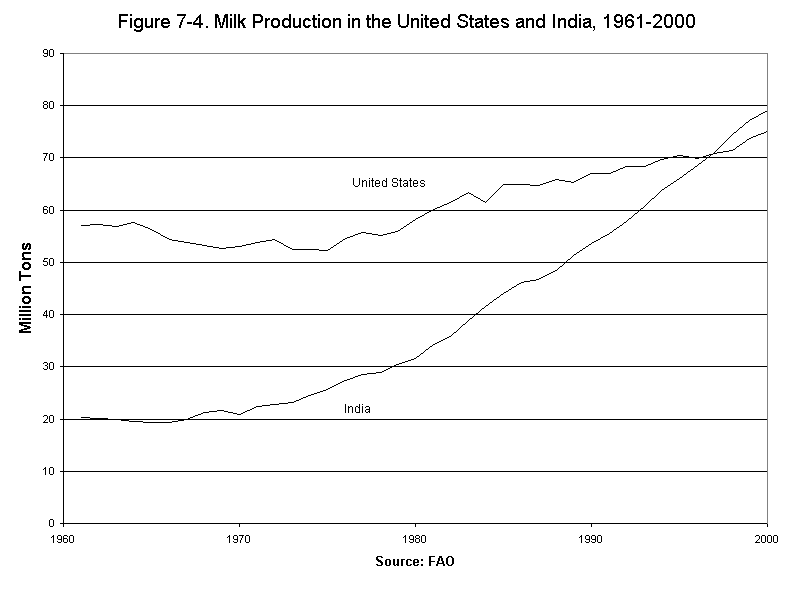
In India, both water buffalo, which are particularly good at converting coarse roughage into milk, and cattle figure prominently in the dairy industry. India has been uniquely successful in converting crop residues into milk, expanding production from 20 million tons in 1961 to 79 million tons in 2000—-a near fourfold increase. Following a path of steady growth, milk became India's leading farm product in value in 1994. In 1997, India overtook the United States to become the world's leading milk producer. (See Figure 7-4.) Remarkably, it did so almost entirely by using farm byproducts and crop residues, avoiding the diversion of grain from human consumption to cattle.50
Between 1961 and 2000, India's milk production per person increased from 0.9 liters per week to 1.5 liters, or roughly a cup of milk per day. Although this is not a lot by western standards, it is a welcome expansion in a protein-hungry country.51
The dairy industry structure in India is unique in that the milk is produced almost entirely by small farmers, who have only one to three cows. Milk production is integrated with agriculture, involving an estimated 70 million farmers for whom it is a highly valued source of supplemental income. Dairying, even on a small scale, is a labor-intensive process, including gathering the roughage where cows are stall-fed, milking them, and transporting the milk to market. Ownership of a few cows or buffalo also means a supply of manure for cooking fuel and for fertilizer. If India can introduce new energy sources for cooking, it will free up more cow manure for fertilizer.52
China also has a large potential to feed corn stalks and wheat and rice straw to cattle or sheep. As the world's leading producer of both rice and wheat and the second ranked producer of corn, China annually harvests an estimated 500 million tons of straw, corn stalks, and other crop residues. At present, much of this either is burned, simply to dispose of it, or is used in villages as fuel. Fortunately, China has vast wind resources that can be harnessed to produce electricity for cooking, thus freeing up roughage for feeding additional cattle or sheep.53
The ammoniation of crop residues (that is, the incorporation of nitrogen) in the roughage helps the microbial flora in the rumen of the cattle and sheep to digest the roughage more completely. The use of this technology in the major crop-producing provinces of east central China—Hebei, Shandong, Henan, and Anhui—has created a "Beef Belt." Beef output in these four provinces now dwarfs that of the grazing provinces of Inner Mongolia, Qinghai, and Xinjiang.54
Ruminants also produce soil-enriching manure that not only returns nutrients to the soil, but also adds organic matter, which improves both soil aeration and water retention capacity, thus enhancing soil productivity. Roughage-based livestock systems are almost necessarily local in nature because roughage is too bulky to transport long distances.
Satisfying the demand for protein in a protein-hungry world where water scarcity is likely to translate into grain scarcity is a challenge to agricultural policymakers everywhere. If grain becomes scarce, as now seems likely, other countries, such as the United States, Canada, and France, may follow India's example of using ruminants to systematically convert more crop residues into food.
| Table 7-3. World Growth in Animal Protein Production, by Source, 1990-2000 | ||||||||||||||
|
||||||||||||||
|
11990-98 only. Source: See endnote 41. |


ENDNOTES:
39. Figure 7-3 from FAO, FAOSTAT, op. cit. note 14.
40. Conversion ratio for grain to beef based on Baker, op. cit. note 15; pork conversion data from Leland Southard, Livestock and Poultry Situation and Outlook Staff, ERS, USDA, Washington, DC, discussion with author, 27 April 1992; feed-to-poultry conversion ratio derived from data in Robert V. Bishop et al., The World Poultry Market-Government Intervention and Multilateral Policy Reform (Washington, DC: USDA, 1990); conversion ratio for fish from USDA, op. cit. note 16.
41. FAO, Yearbook of Fishery Statistics: Capture Production and Aquaculture Production (Rome: various years); FAO, FAOSTAT, op. cit. note 14.
42. Oceanic fish catch growth rate from FAO, op. cit. note 16; for aquacultural output data, see FAO, Yearbook of Fishery Statistics: Aquaculture Production 1998, vol. 86/2 (Rome: 2000).
43. FAO, op. cit. note 42.
44. K.J. Rana, "China," in Review of the State of World Aquaculture, FAO Fisheries Circular No. 886 (Rome: 1997), www.fao.org/fi/publ/circular/c886.1/c886-1.asp; information on rice and fish polyculture from Li Kangmin, "Rice Aquaculture Systems in China: A Case of Rice-Fish Farming from Protein Crops to Cash Crops," Proceedings of the Internet Conference on Integrated Biosystems 1998 www.ias.unu.edu/proceedings/icibs/li/paper.htm, viewed 5 July 2000.
45. Information on China's carp polyculture from Rosamond L. Naylor et al., "Effect of Aquaculture on World Fish Supplies," Nature, 29 June 2000, p. 1022; polyculture in India from W.C. Nandeesha et al., "Breeding of Carp with Oviprim," in Indian Branch, Asian Fisheries Society, India, Special Publication No. 4 (Mangalore, India: 1990), p. 1.
46. Krishen Rana, "Changing Scenarios in Aquaculture Development in China," FAO Aquaculture Newsletter, August 1999, p. 18.
47. Catfish feed requirements from Naylor et al., op. cit. note 45, p. 1019; U.S. catfish production data from USDA, ERS-NASS, Catfish Production (Washington, DC: July 2000), p. 3.
48. FAO, op. cit. note 42.
49. For information on the role of ruminants in agriculture, see Council for Agricultural Science and Technology, "Animal Production Systems and Resource Use," Animal Agriculture and Global Food Supply (Ames, IA: July 1999), pp. 25-54, and H.A. Fitzhugh et al., The Role of Ruminants in Support of Man (Morrilton, AR: Winrock International Livestock Research and Training Center, April 1978), p. 5.
50. Roughage conversion from A. Banerjee, "Dairying Systems in India," World Animal Review, vol. 79/2 (Rome: FAO, 1994), and from S.C. Dhall and Meena Dhall, "Dairy Industry-India's Strength Is in Its Livestock," Business Line, Internet Edition of Financial Daily from The Hindu group of publications, www.indiaserver.com/businessline/1997/11/07/stories/03070311.htm, 7 November 1997; Figure 7-4 from FAO, Food Outlook, no. 5, November 2000; FAO, FAOSTAT, op. cit. note 14.
51. Calculation based on data from FAO, op. cit. note 50.
52. Banerjee, op. cit. note 50.
53. China's crop residue production and use from Gao Tengyun, "Treatment and Utilization of Crop Straw and Stover in China," Livestock Research for Rural Development, February 2000.
54. Ibid.; China's "Beef Belt" from USDA, ERS, "China's Beef Economy: Production, Marketing, Consumption, and Foreign Trade," International Agriculture and Trade Reports: China (Washington, DC: July 1998), p. 28.
Copyright © 2001 Earth Policy Institute

